
Acoustic parameters
Sound pressure level (SPL)
SPL in the acoustic field of a one-port source can be computed and displayed over the frequency spectrum of the source in dB (L, A, B, C), phon or sone units, or in 1/N octave bands.
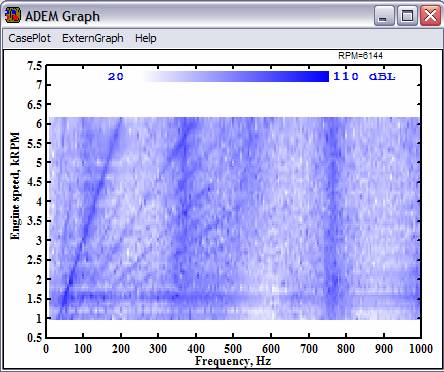
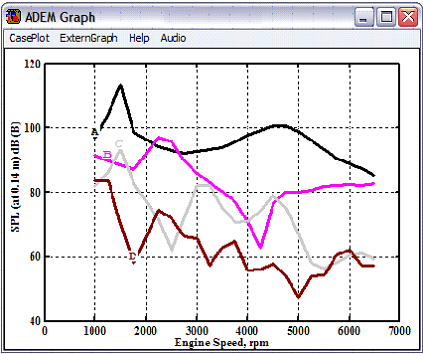
SPL radiated from variable speed fluid machinery intake and exhaust outlets can be computed and displayed in the form of a Campbell diagram (Figure 1). Horizontal and inclined cuts of a Campbell diagram can be generated. Horizontal cuts show variations of SPL with the frequency at specific rotational speeds; inclined cuts show the variation of SPL with the rotational speed for selected harmonic orders of the rotational speed. In Figure 2 curves A, B, C and D are the order cuts of Figure 1 for orders 2, 4, 6 and 8, respectively.
Insertion loss
The difference in SPL at a target point before and after a silencer is mounted on a duct system is called Insertion Loss (IL). IL can be predicted by two SPL calculations. It can also be computed approximately by assuming that the characteristics of the source remain unchanged after the silencer is inserted, and that the silencer replaces a lossless pipe.
Noise Reduction
Noise Reduction (NR) gives the level difference of sound pressures at two different points of a duct system and does not depend on the source characteristics. NR between two ports of a block diagram, or between the standing pressure wave maxima in the inlet and outlet ducts of a silencer, or between the equivalent source plane and a target point in the exterior environment of the open end of an intake or exhaust system can be computed. The latter may provide an estimate of the Insertion Loss under certain conditions (see Duct Acoustics).
Attenuation
Attenuation is defined as the level difference between the incident sound pressures at two different points, which are usually taken at the equivalent source plane and the open end, of an intake or exhaust system. Calculation of Attenuation does not require information about the source characteristics. Under certain conditions, Attenuation may be used to estimate Insertion Loss (see Duct Acoustics).
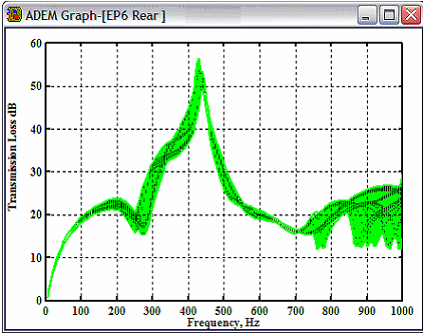
Transmission Loss
This classical parameter (TL) gives the level difference between the incident acoustic power at the inlet and outlet of a muffler or silencer, assuming outlet(s) is anechoic (non-reflecting or an infinitely long duct). TL of silencers with multiple inlet or outlet pipes can be computed. TL can be computed for multi-modal propagation at the inlet and outlet of a system in 1/N octave bands.
Transfer matrix
The transfer matrix between inlet and outlet ports of a system in wave or impedance format and as function of frequency or as function specific orders of rotational speed can be computed. Sound propagation can be three-dimensional, except at the inlet and outlet of the system, where only one-dimensional waves are assumed to be propagating. Measured or FEM based transfer matrices can be imported for use as acoustic elements.
Acoustic path index
This index may be used for the assessment of the likelihood of meeting a specified SPL target with a given silencer prototype. See Duct Acoustics for the definition and uses of this parameter.
Equivalent one-port source
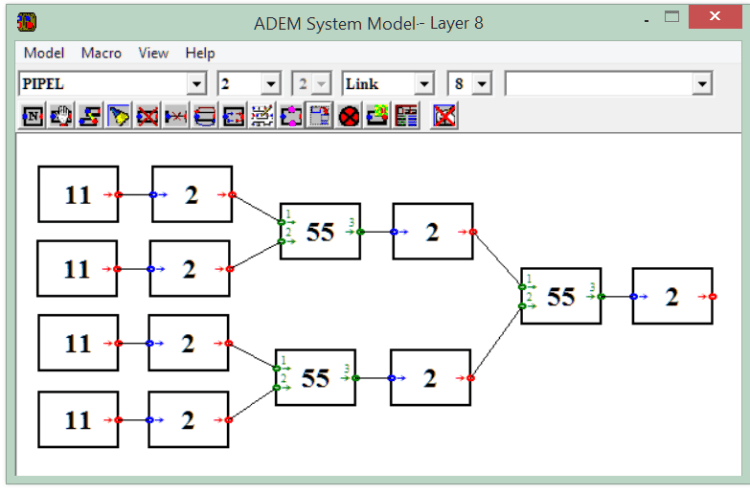
Figure 4 shows the block diagram of a system which consists of four one-port spectral sources (element 11) on a network converging to single duct, as in four-cylinder engine manifolds. Such multiple-source networks can be applied to a block diagram explicitly, or implicitly after reduction to a one-port source element (see)
Sectional parameters
The following parameters can be calculated at the main line nodes in layer 1 of a block diagram model of a duct system: Acoustic Power, Reflection coefficient, Acoustic impedance.
Transverse duct modes
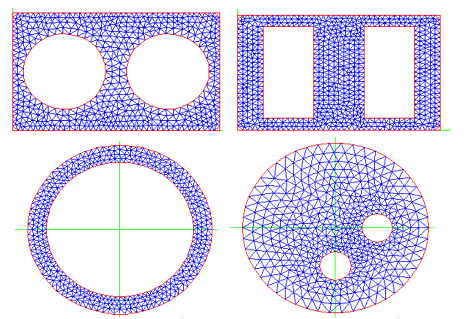
Modeling of three-dimensional effects on sound propagation in ducts requires computation of the transverse duct modes. The eigenvalues and eigenfunctions of hard-walled ducts of any connected geometry can be computed by using the finite element method from a stand-alone user interface. Duct shapes may be circular, rectangular, elliptical, oval or any simply connected curve consisting of linear and circular segments.
Finite element meshes are generated automatically and the computed duct modes can be linked to modal acoustic elements. Cut-outs may be circular, rectangular or elliptical. Figure 3 shows the finite element meshes generated for some sections. The eigenvalues and the corresponding nodal lines can be viewed on the user interface.
Optimization
There are several tools that equip the user with the ability to determine systematically the details of muffler or silencer concepts that meet a given target performance.
Firstly, acoustic parameters can be computed as functions system parameters, enabling design of experiment (DOE) simulations. The parameters are activated directly from element datasheets and can be used as variables in mathematical expressions defining constraints using a simple script notation.
Secondly, provided are systematic direct search algorithms for accelerated searching of local optima under arbitrary number of equality and inequality constraints. The search process is followed on-line on the graphical output interface and the speed of convergence can be monitored by the user.
Thirdly, acoustic performance parameters can be computed in stochastic intervals corresponding to variations of selected system parameters in given intervals. This is of particular importance when uncertainty exists about the values of some element parameters and the designer wants to know the sensitivity of the system to possible variations.
For example, Figure 5 shows the sensitivity of a silencer to the value of the end-correction applied at a sudden are-change. Heuristic (experimental or theoretical) values are often proposed as end correction to account for the higher order mode effects at such discontinuity, but these are strongly dependent on the actual system geometry. Interval plots such as Figure 5 provide better assessment of the effects of variations due to the fuzziness of the end-correction.
Finally, there is the Inverse Search Method. This method enables the user to select, from a group of admissible prototypes, the one that satisfies a given SPL target in the frequency or order range of a given equivalent source, without actually carrying out SPL calculations (see Duct Acoustics for further details).
Back-pressure
Acoustic design of mufflers and silencers for intake and exhaust systems is often subject to an upper bound target for the back pressure. Mean pressure losses in system components are computed in the background of acoustic calculations and reported in a standalone user interface which can also be used for a priori estimation of the pressure losses. A calculator is also available for the estimation of the mean temperature gradients in duct elements.
